Guardey's Learning Management System (LMS) offers detailed insights into group statistics and performance. This guide will help you effectively track your teams' progress.
Accessing group performance data
To view your group's performance metrics:
Step 1: Log into the admin portal
Step 2: Navigate to users
Step 3: Select groups
Step 4: Click manage group
Accessing the groups leaderboard:
Step 1: Log into your admin portal
Step 2: Click the game tab
Step 3: Select groups leaderboard
Your group dashboard includes several key metrics:
Insights
- Score overview per module
- User distribution across skill levels
- Top and bottom performers identification
Modules
- Correct answer rates per module
- Participation levels across content areas
Challenges
- Performance breakdown per challenge
- Challenge timing and type information (bonus/weekly)
- Module-specific challenge data
User statistics
- Individual user scores
- Question accuracy rates
- Participation metrics
- Challenge completion status
ℹ️ Use the three-dots menu in each section to export data as CSV or PDF files for further analysis.
Team leaders can also access group statistics independently. Learn more in our help center article on generating game reports.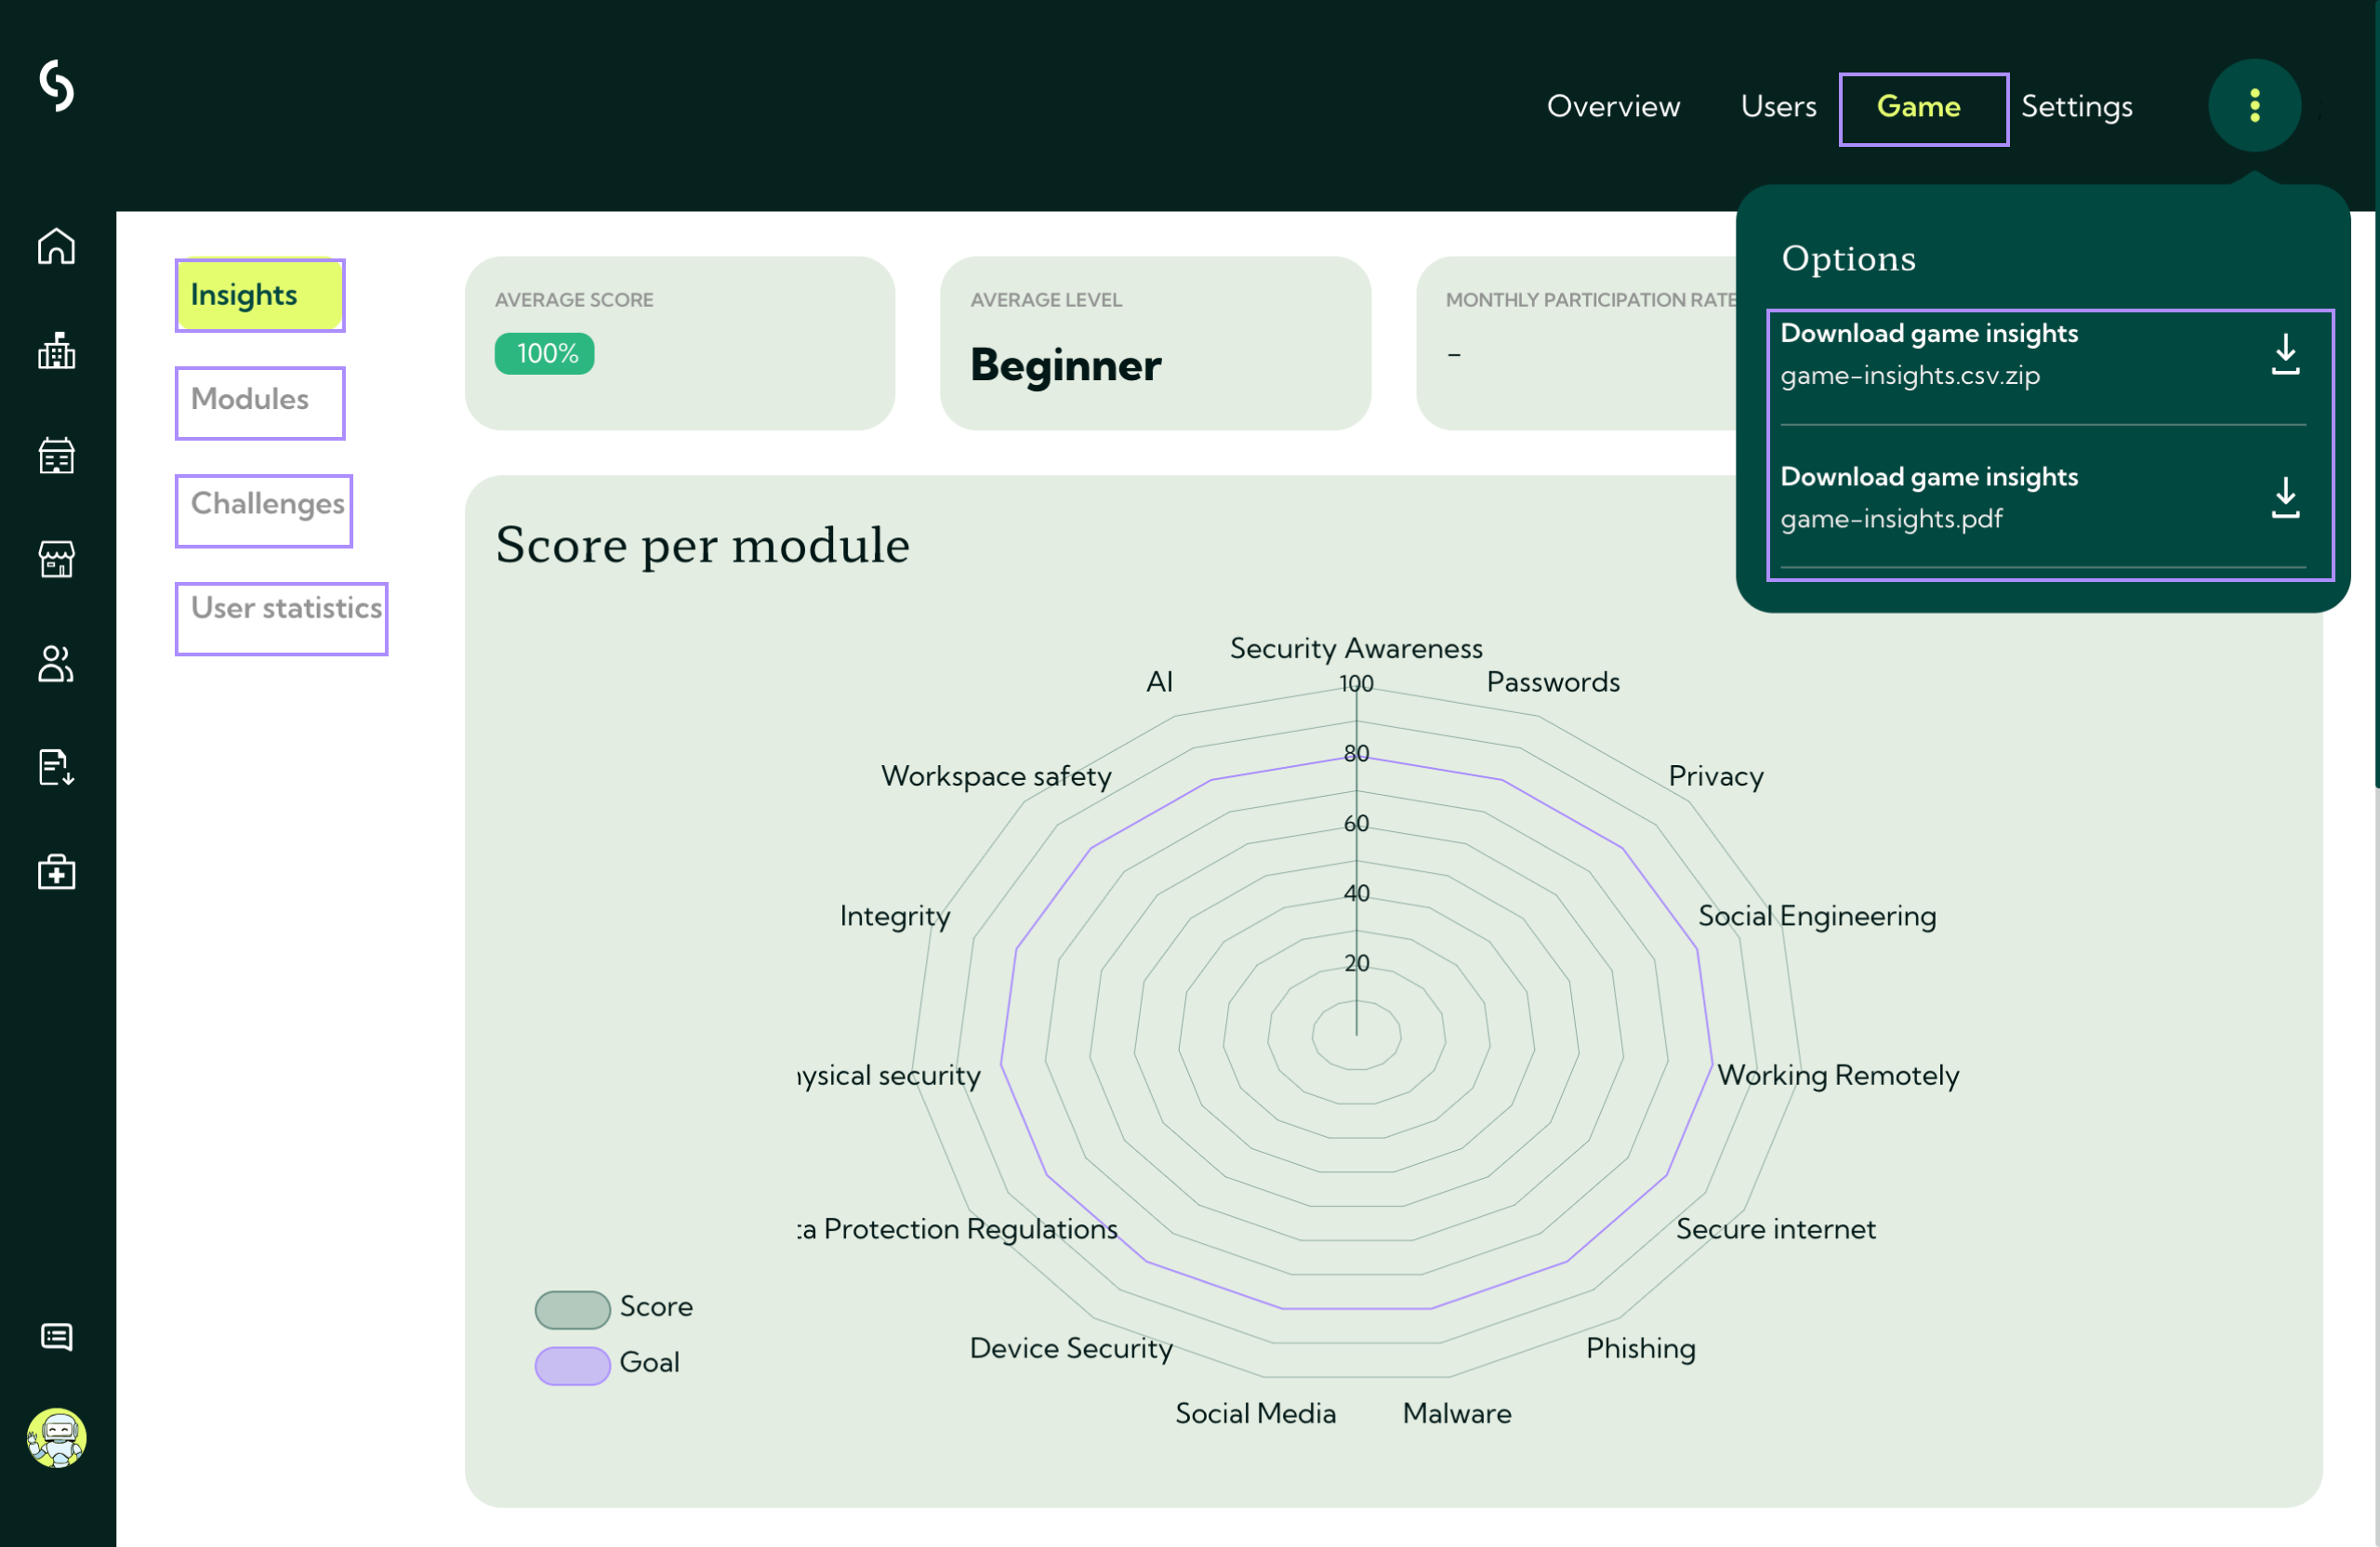
Understanding group performance vs. groups leaderboard
Guardey offers two distinct views for analyzing group data, each serving different purposes:
Group performance
Best for detailed analysis and training optimization.
This view includes:
- Module and challenge performance breakdowns
- Detailed participation rates
- Accuracy and completion statistics
- Actionable insights for identifying knowledge gaps
Use this view to make data-driven training decisions and understand your team's specific strengths and areas for improvement.
Groups leaderboard
Best for quick competitive overview and motivation.
This view shows:
- Total XP earned by each group
- Average reputation score per group
- Challenge completion rates by group
- Competitive rankings based on group performance
The leaderboard emphasizes competition and motivation rather than detailed analytics. It can combine multiple teams into unified groups for ranking purposes.
ℹ️ The current groups leaderboard displays all-time scores and operates independently from seasonal leaderboards visible in the user portal.
Both views complement each other, use performance data for strategic insights and the leaderboard for team motivation.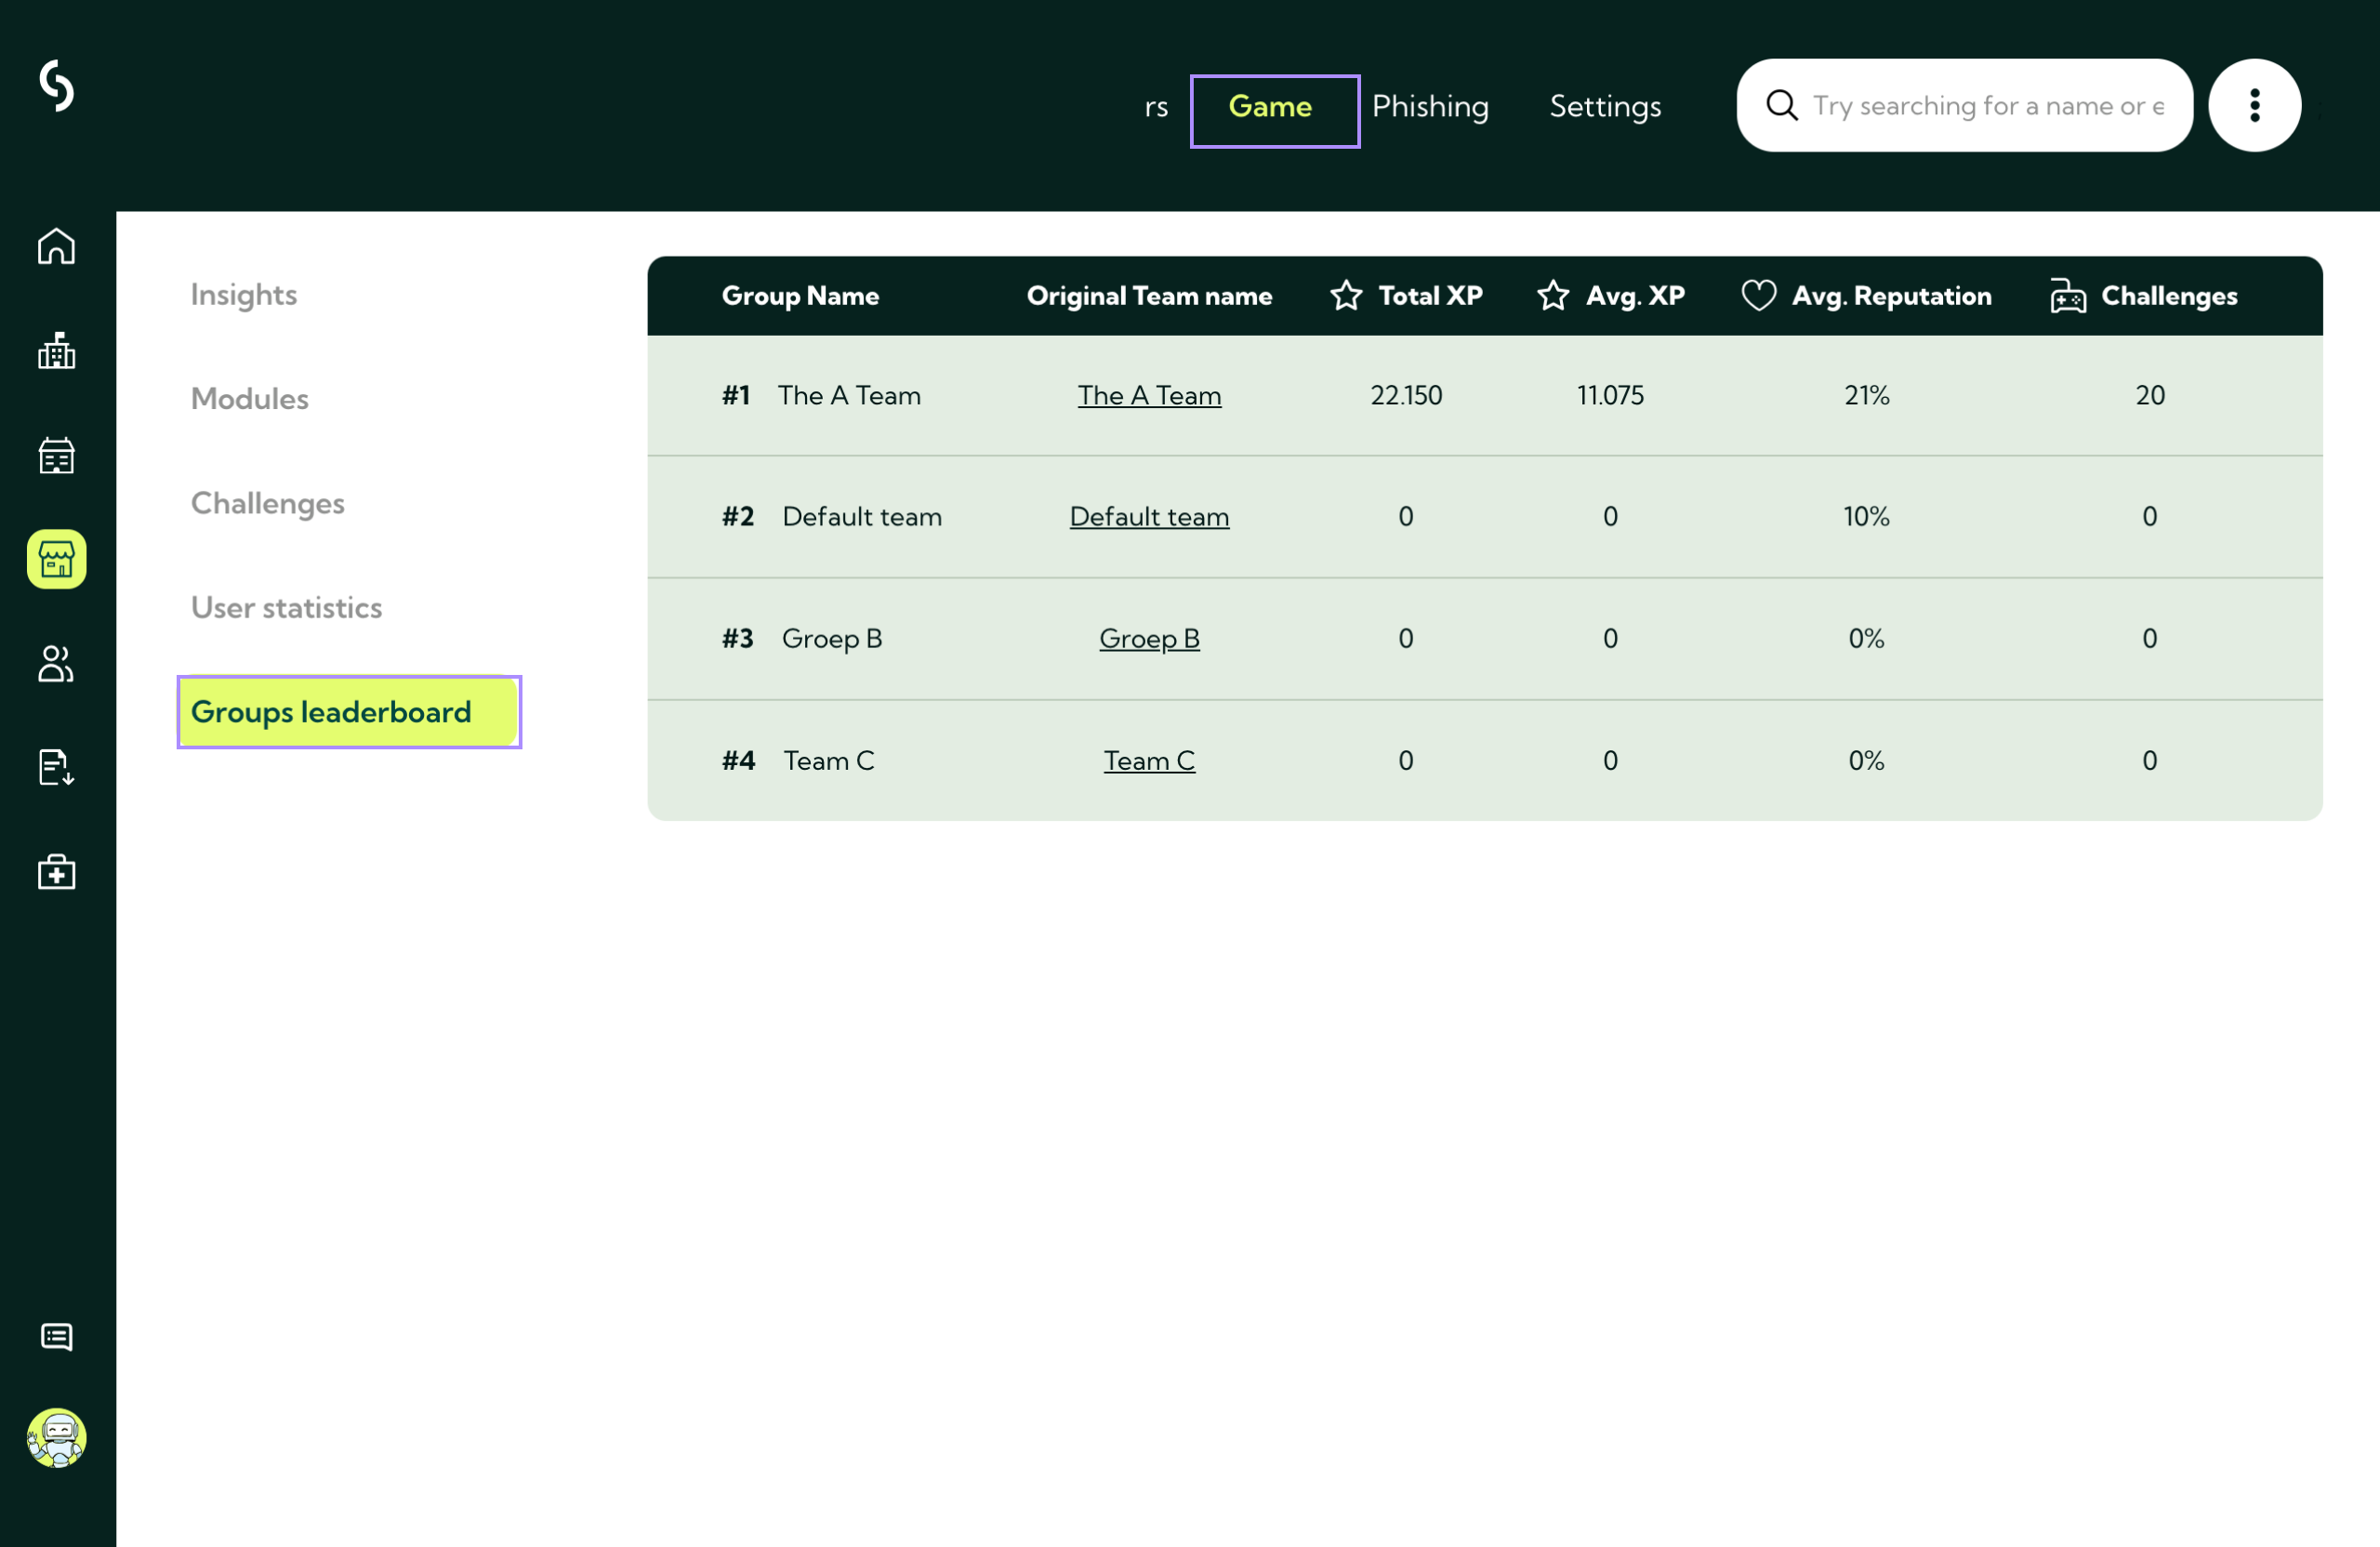
Next Steps:
Want to dive deeper into individual performance? View individual user performance metrics here.
Related to